I have been asked several times how I have generated the network that displays shortest connections between selected pairs of nodes (based on Isvoranu et al., 2016).
Even though at the time of writing the paper I have manually coded the pathways (which made it quite difficult to explain it and took some time to write), the function to generate such a network has now been implemented in the R package qgraph. Below is a description of how the function pathways works, taken from the qgraph documentation. At the end of this page there is also an example that can be run in R. For any further questions please contact me via email.
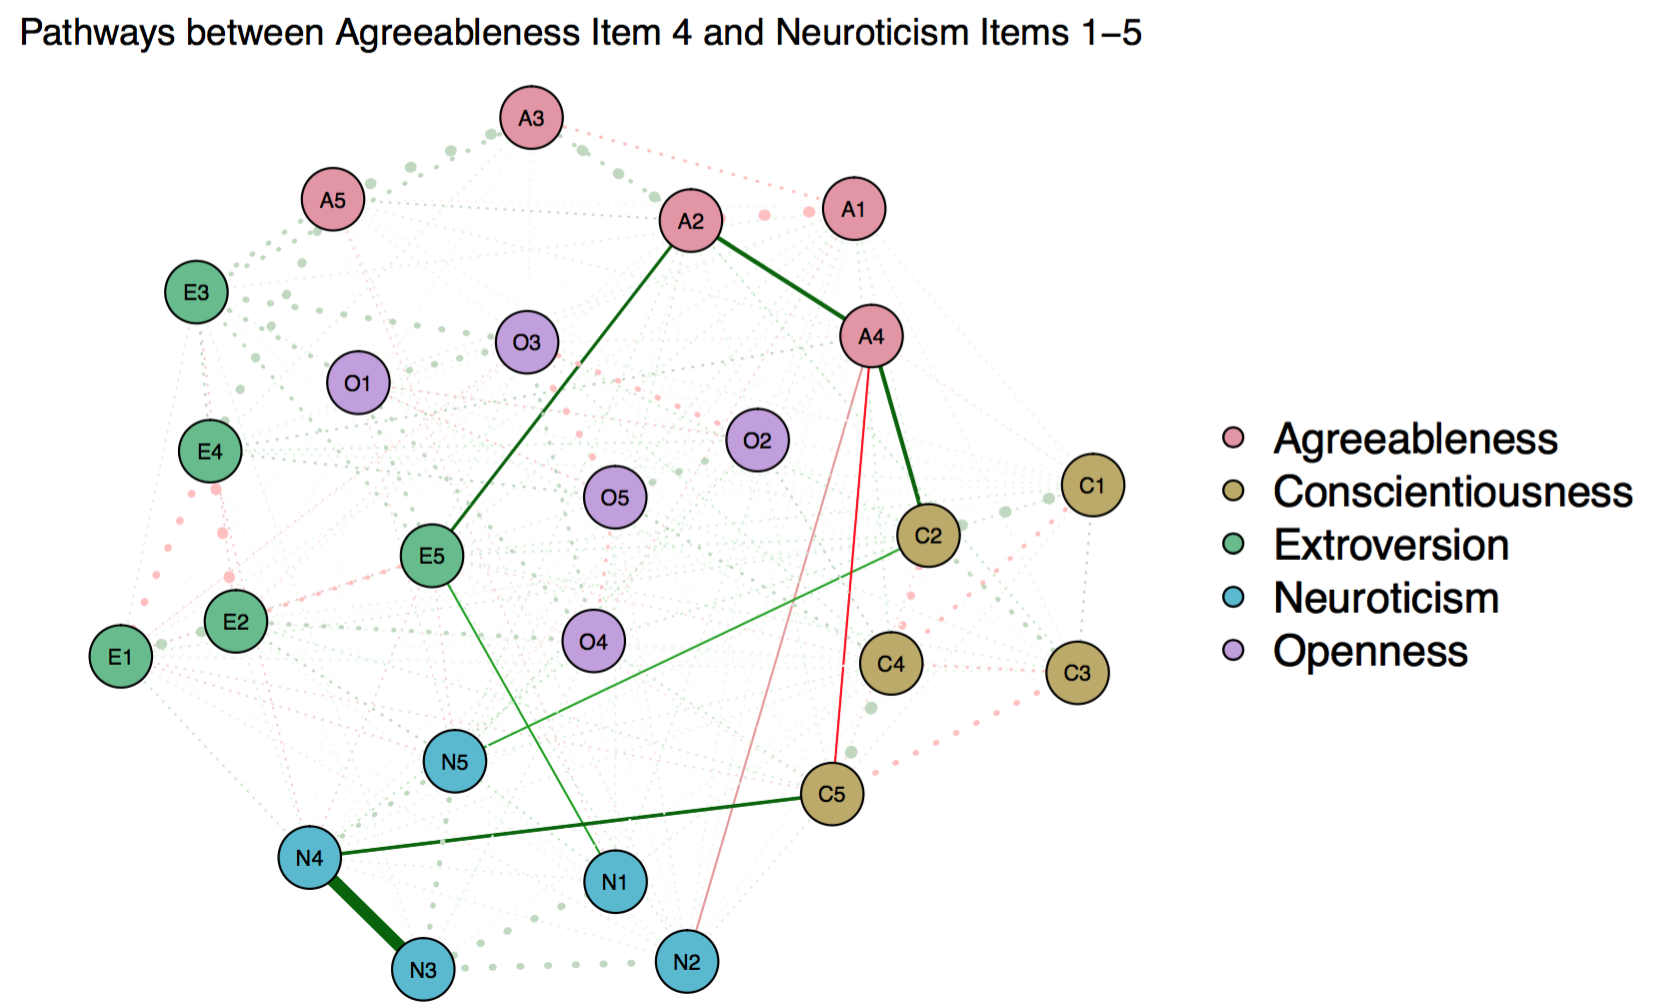
pathways Highlight shortest pathways in a network
Description This function highlights the shortest paths between nodes in a network made by qgraph. Based on Isvoranu et al. (2016).
Usage pathways(graph, from, to, fading = 0.25, lty = 3)
Arguments
graph Output from qgraph.
from A vector indicating the first set of nodes between which pathways should be highlighted. Can be numeric or characters corresponding to node labels.
to A vector indicating the second set of nodes between which pathways should be highlighted. Can be numeric or characters corresponding to node labels.
fading The fading of the edges that are not part of shortest paths between ’from’ and ’to’.
lty The line type of the edges that are not part of shortest paths between ’from’ and ’to’.
Author(s): Sacha Epskamp & Adela M. Isvoranu
Example (can run in R)
library(“qgraph”)
library(“psych”)
data(bfi)
# Compute correlations:
CorMat <- cor_auto(bfi[,1:25])
# Compute graph with tuning = 0 & Create big5 groups:
groups <- list(“Agreeableness”=1:5, “Conscientiousness”=6:10, “Extroversion”=11:15, “Neuroticism”=16:20, “Openness”=21:25)
BICgraph <- qgraph(CorMat, graph = “glasso”, sampleSize = nrow(bfi), tuning = 0, layout = “spring”, title = “BIC”, groups=groups, pastel = TRUE)
# All paths between Agreeableness and Neuroticism:
# N.B.: The first argument is the matrix, from and to demarcate the relevant edges
pathways(BICgraph, from = c(“A1″,”A2″,”A3″,”A4″,”A5”), to = c(“N1″,”N2″,”N3″,”N4″,”N5”))